Field Exercises: Unique and Challenging
Here at the SFS Centre for Rainforest Studies in Australia, a majority of our classes consisted of different field exercises (FEXs) that were specific to each subject area and to our professors’ long-term research goals. Each was unique and challenging for different reasons. I’ll briefly go through the FEXs now.
Principles of Rainforest Management with Dr. Catherine Pohlman — Assessing the progress of 20-year-old revegetation plots in comparison to natural regrowth (40-years-old) and primary growth forest
In the field: We created rectangular plots and surveyed all trees with a diameter at breast height (DBH) of great than 1cm. We recorded the DBH and species of each tree, then marked each with pink paint at breast height so that future researchers would know where we measured. Surveys were conducted with this methodology in each of the treatment plots (T1-T5) and in nearby secondary and primary growth forests.
Data analysis: I chose to analyse basal area (square meter per hectare), which correlates strongly with both aboveground biomass and carbon storage. All plots except for T1 and T2 (the control plot and the plot that utilised only pioneer species) had basal area values comparable to the primary growth forest.
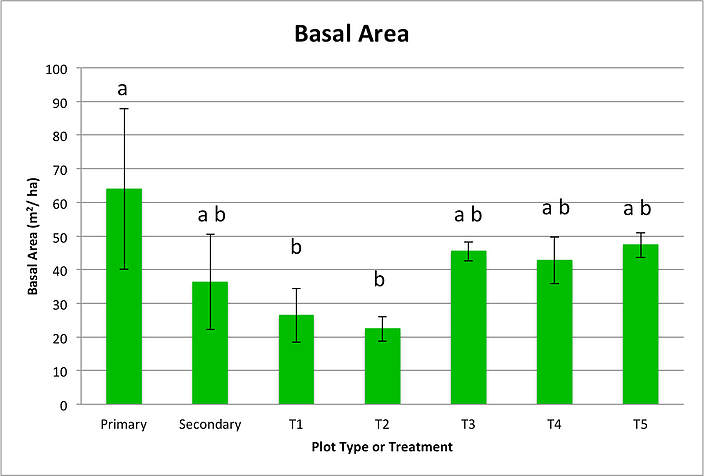
Figure 1: The results of the ANOVA run for basal area values across different plots. Significant differences (P<0.05) are indicated and error bars show +/-1SE.
I also looked at species richness, which is the number of unique species present in each plot.
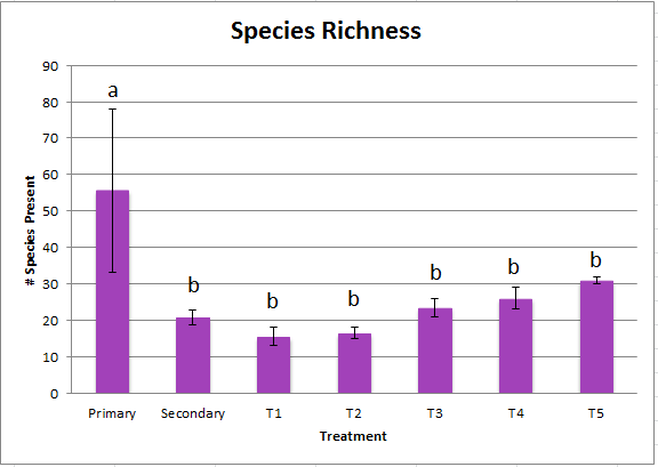
Figure 2: The results of the ANOVA run for species richness values across different plots. Significant differences (P<0.05) are indicated and error bars show +/-1SE.
Another way to look at species richness is by making a species rarefaction curve. Essentially, it shows you the relationship between the sampling effort (x) and how many species you find based on that effort (y). A steeper curve means that you get a lot of new species per additional sample, meaning that the maximum number of species will take a lot of sampling effort to survey completely. Curves that flatten out faster require less sampling effort to obtain all of the species, and curves with similar trajectories likely have similar species richness values.
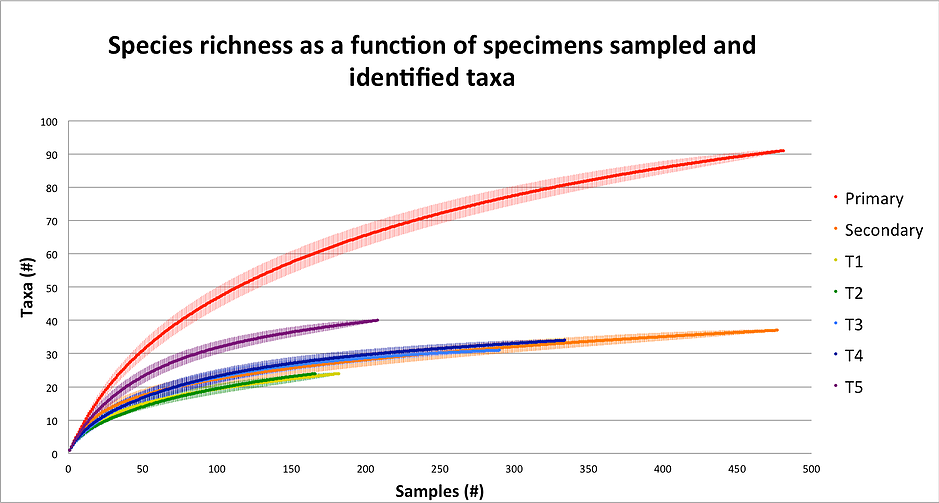
Figure 3: A rarefaction curve showing different species richness per sample taken for different vegetation plots. Error bars show +/-95% CI.
Considering both Figure 2 and Figure 3, it is very clear that the primary growth forest has a significantly higher level of species richness than all of the other plots.
Brief conclusions: Past studies have shown that secondary growth forests (secondary succession) can recover aboveground biomass much faster than they can recover species composition. Additionally, revegetated plots, when properly maintained, can also recover much faster than natural regrowth areas. Here, I showed that the T3-T5 were able to recover their aboveground biomass about twice as fast as natural regrowth plots, while neither the treatment plots or the secondary forests were able to attain species richness values that were comparable to primary growth forest. The goal of restoration is to recover both the structural and functional components of an ecosystem, and so these plots will require additional time before they can be considered fully reconstructed.
Socioeconomic Values and Environmental Policy with Dr. Justus Kithiia — Assessing perceptions of climate change across the Atherton Tablelands
In the field: we interviewed our homestay families with surveys generated by the WWF Climate Crowd (wwfclimatecrowd.org).
Brief results and conclusions: A majority of the residents talked about recent changes in water availability. Here is a flow chart that I created in AtlasTI that analyses the open-ended question responses that were included in the survey. It specifically addresses concerns relating to decreased rainfall.
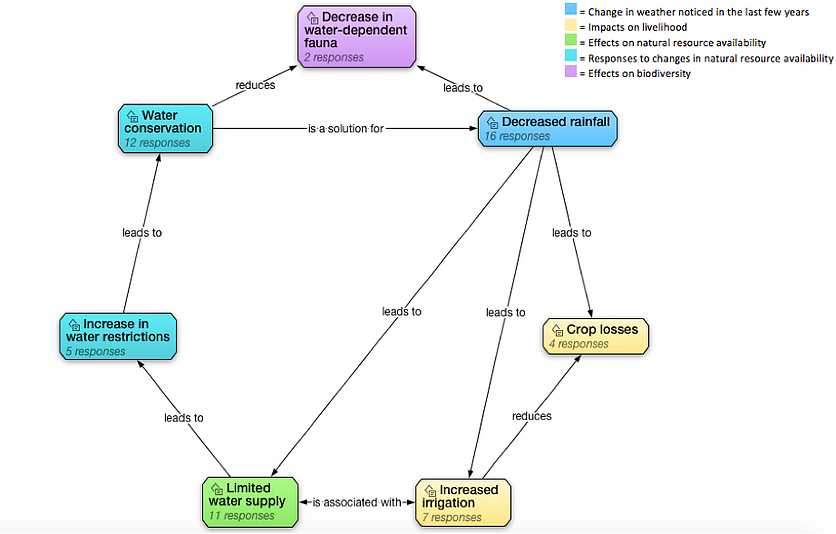
In general, people were less concerned about the impact of decreased rainfall on their livelihood specifically, and more focused on the overall livelihood on the town. For example, residents of Malanda had much higher response rates for all of the issues shown above, which was likely due to their town’s main industry, which is dairy farming. Conversely, residents of Herberton and Yungaburra were only moderately concerned with these issues, which I attributed to the fact that their town’s livelihoods are more diverse, and not depended on a single industry.
Rainforest Ecology with Dr. Siggy Heise-Pavlov — Determining suitable habitat for the vulnerable yellow-bellied glider (Petaurus australis) (YBG)
In the field: This experiment was two-fold. First, we assessed potential YBG habitat in the wet sclerophyll forests near Herberton, QLD. We conducted vegetation surveys along transects, specifically looking at Lantana (an invasive weed), canopy cover, and the presence of den trees (large rose gum eucalyptus; Eucalyptus grandis) and feeding trees (red mahogany eucalyptus; E. resinifera). In the evening, we then watched the gliders on active (sap flowing) feeding trees, and listened to their calls. Our professor is interested in trying to develop call recognition techniques as a way to distinguish individuals to determine YBG abundance indirectly.
Important info on YBGs: These gliders are listed as vulnerable because they live exclusively in the wet sclerophyll forests on the edge of the wet tropics, and these habitats are rapidly shrinking due to invasion by the neighbouring rainforest. Additionally, YBGs are “picky” and will only choose a handful of den and feeding trees to use regularly; for feeding trees, this proportion of “chosen” trees is sometimes as low as 1%. Therefore, it is important to determine what exactly determines their feeding and living preferences in order to create the best management practices for this species.
Note: For this final FEX, we only wrote the introduction and methods section. (For the previous two, you may have noticed that we only did the results and discussion sections.)
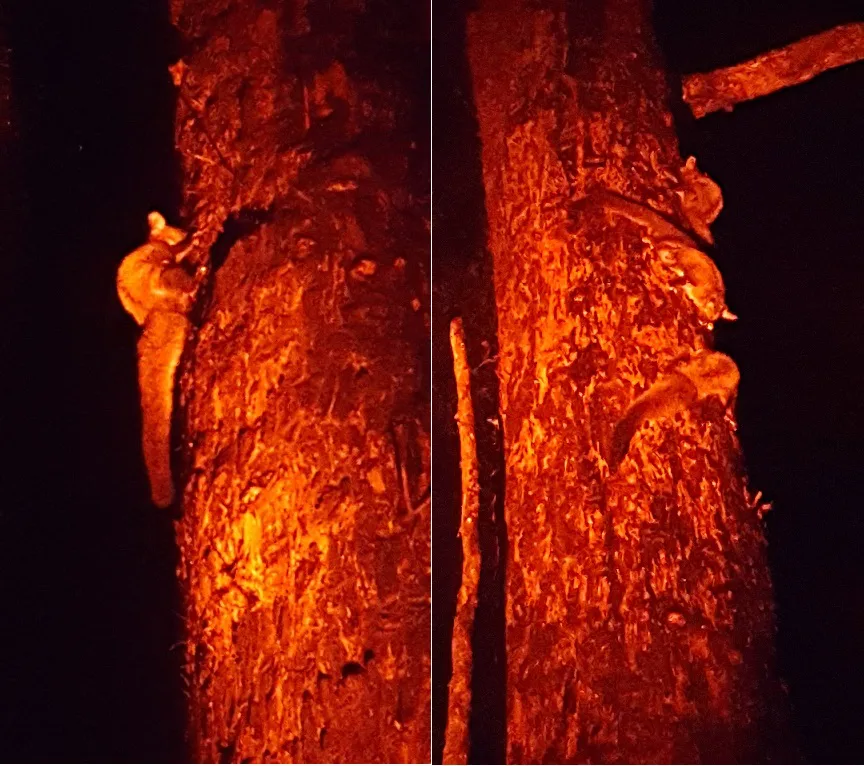
The Very Hungry Gliders
There were three YBGs that were on the red mahogany tree that we were watching on the third and final night of data collection. They fed continuously for the entire hour and a half that we were there. In order to access the sap beneath the tree’s bark, they will use their teeth to puncture the bark and create access points where the sap will freely flow. During the day, these trees are also utilised by birds and insects. At night, they are used by nocturnal possums and gliders, but mostly by the YBGs. They will only choose a few trees to use throughout the year, and we were lucky enough to be able to find one that was actively being fed upon and was also easily accessible. It was magical watching them that night — they are adorable creatures, with big ears, tiny faces, and very long and fluffy tails. When sitting by the tree, you can hear the sound of their teeth on the bark as they hungrily feed on the tasty sap.
Overall, while the FEXs have been some of the most difficult scientific papers I’ve ever written, they were also some of the most rewarding. Back at my home school, we analyse data we collected in a lab setting, and then do a write up that is pretty generic and leaves little room for creative thinking. Here, we collect data in the field, in the rainforest, and then choose the research question that we want to investigate. We then conduct our own data analysis that answers our specific question, and are able to develop conclusions that are both personally meaningful and also contribute to our professors’ long term research goals. While being here, I am both growing as a scientist and helping develop research that may soon influence policy that will impact and help preserve the Wet Tropics.
Related Posts